
 The availability of data and tools to analyze them have increased significantly over the past few years. Many companies have added pricing analytics capabilities and have purchased new data visualization tools. Those are steps that can improve profitability, if they are focused on the right pricing analyses. Unfortunately, too many companies spend their time creating cool new visualizations of basic metrics that are of limited use. To capture greater margins, it is important to focus on more granular indicators of price effectiveness that can enhance decision making.
The most common measurements we see in pricing departments are Average Selling Price (ASP) by category, Gross Margins by segment, and Gross Margins by customer. They are interesting, but not necessarily actionable. For example, we have seen client charts that measure monthly ASP for the highest selling product categories. If the ASPs are generally up-sloping, the client will typically interpret that they are doing a good job of increasing prices. But too much variation can be hidden in broad measurements like that. It is much more insightful to quantify the amount of changes in sales and margin coming from price, volume changes, and changes in customer or product mix. We call this the Rate Volume Mix Analysis (“RVM”).
Rising ASPs in a category can be caused when prices are not increased at all by simply selling more high-priced products, or selling a larger proportion of products to smaller, higher-priced customers. Conversely, if the RVM is calculated granularly, i.e., at the individual customer/product level, and then aggregated to the category or company level, it is easy to tell whether prices are actually increasing. Each of the 2 RVM charts below show Gross Margin increasing from $90 million to $100 million, however in the first chart prices decreased (2nd column on the left if red). Changes in customer and product mix offset the lower prices. In the chart on the right, prices increased (2nd column on the left is green). In both cases the volume change is equally positive (more units purchased by the same customer, same product).
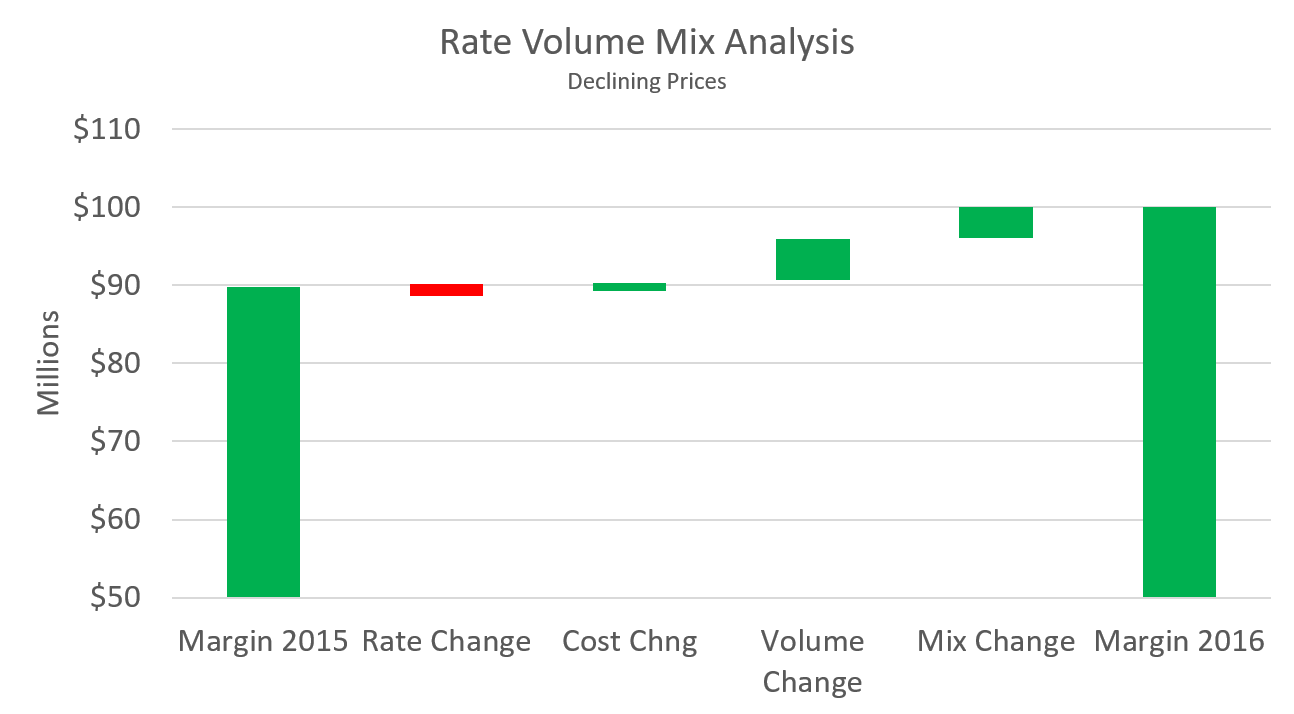
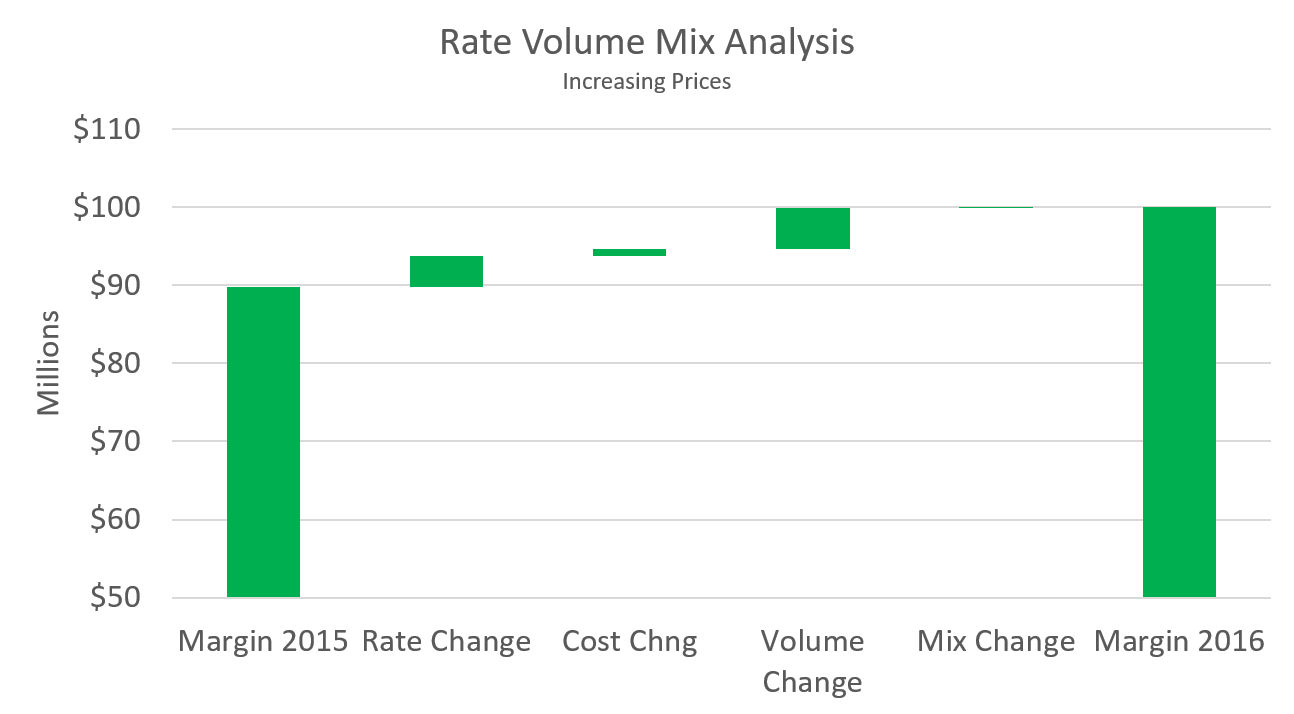
You might wonder what’s the big deal? As long as Gross Margin increased you should be happy, right? Unfortunately, it’s not that simple. When the margin increase comes from selling to more small customers at higher prices, the cost to serve those smaller accounts is also typically higher, leading to overall lower profitability. On the other hand, higher prices do not lead to higher cost to serve, and therefore increase profitability.
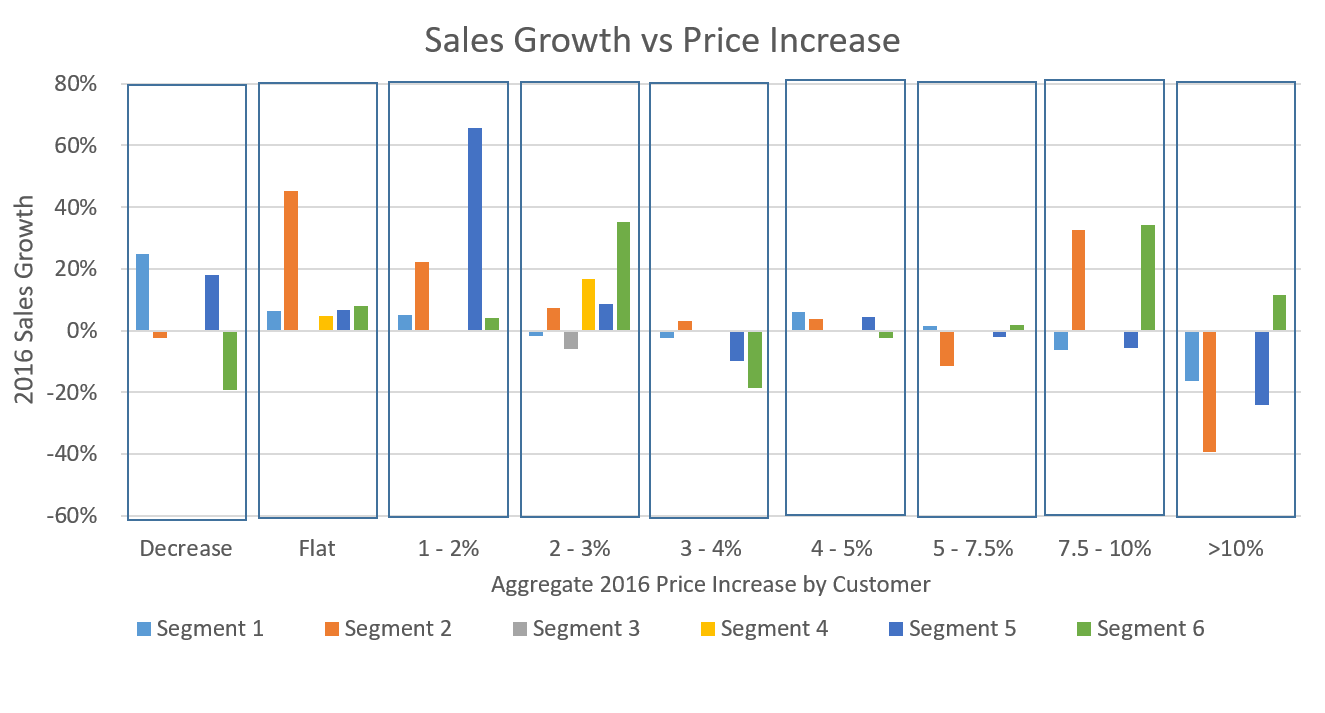
Even with the 2nd chart, in which prices increased and volume increased, it is worth looking deeper. In a B2B world, some customers may receive higher price increases than others, and some may receive price decreases. Although the aggregate total looks acceptable, it is important to look at how the magnitude of price changes affected the results. In the chart below, we group customers within segments by the magnitude of the price increase they received, and plot their respective sales growth rates. Except for Segments 2 and 6, higher price increases generally resulted in sales decreases. Since the customers are grouped, it is also important to dig a little deeper to determine if the sales decreases are caused by a few customers or if the result is widespread.
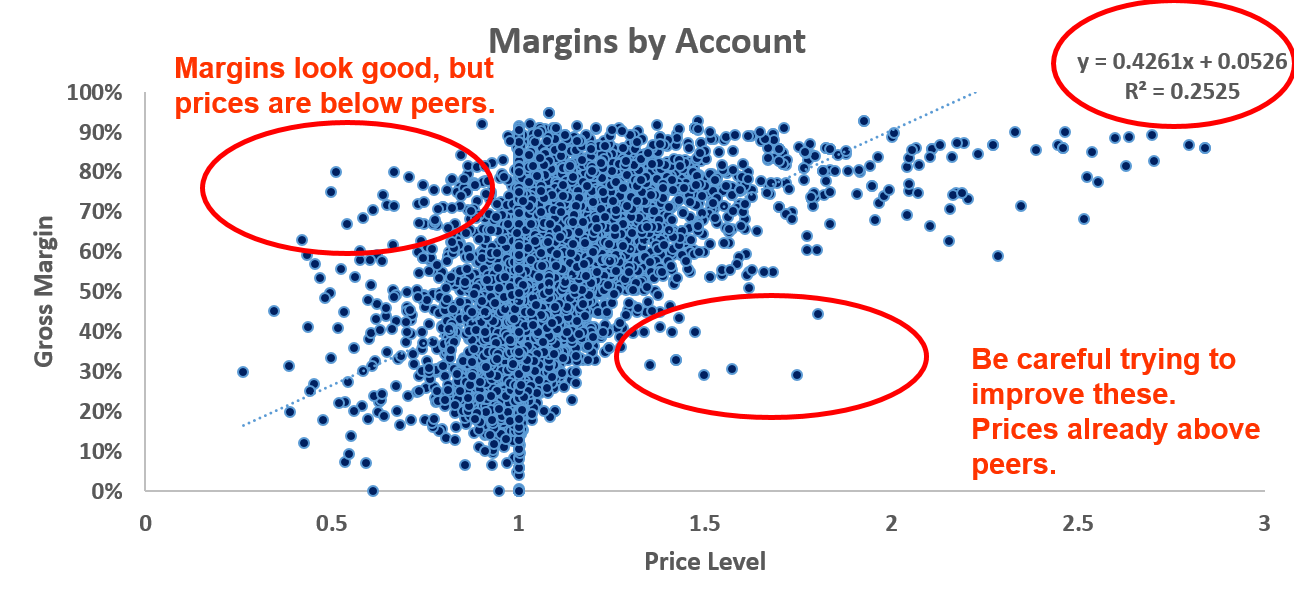
 These are just a couple examples of analyses that can lead to actionable insight. There are more. I have written in previous blogs about companies that look at Gross Margins by customer (see chart below) and act on low-margin customers. While that is an interesting start, it is critical to look at price levels, not just low-margin customers. Since products have varying Gross Margins, customers who are paying relatively high prices for the products they are buying could have low overall margins. Increasing their prices even more could cause them to defect, lowering your overall profitability.
Other analyses that would help include:
- Customer retention rates to determine the frequency of customer defection
- Win/Loss metrics by segment and type of customer or prospect
- Historical elasticity to determine how price changes have affected sales volume
- Pricing performance by territory and segment
The bottom line is pricing analytics must be focused on the right things and the right level of detail to provide any real insight. Colorful dashboards that measure the wrong things or just measure averages can lead to counter-productive decisions and inappropriate changes in pricing strategy.


Leave a Reply
Want to join the discussion?Feel free to contribute!