 I have written blogs in the past highlighting the importance of data analytics in pricing, but it is also worth a reminder not to jump to conclusions. Last week the Wall Street Journal published an article, Doctor-Pay Trove Shows Limits of Medicare Billing Data, whose main point was there could be many reasons for a doctor to appear on the list of high Medicare reimbursements, and not all of those reasons are bad. Although it can be tempting, and perhaps efficient, to draw conclusions quickly (and politicians do that all the time), there are consequences for drawing incorrect conclusions.
Let’s consider some examples. A company decided to run some promotions to generate incremental sales. They offered discounts or free products when customers purchased certain targeted products. They pride themselves on being data driven and wanted to track the results of the promotion, so they required a specific code to be entered each time an item was ordered under the promotion. At the end of each month, they measured the number of sales that occurred with the promotion codes and found they had sold more targeted products in the promotion than planned. A big success, right? Well, maybe, but not necessarily. There are additional questions that need to be asked:
- How many of the targeted products sold were purchased by new customers rather than customers who previously purchased those targeted products anyway?
- For customers that already bought targeted products, the promotion just lowered the margins on their purchases.
- How many of the customers new to the target products previously purchased the items that were now given away under the promotion?
- For these customers, it is important to look at the combined margins of targeted and free products versus the margins previously earned on the products when they were not free
- Is the company’s overall margin increasing at a faster rate after the promotion than pre-promotion?
Promotions can be a good way of convincing customers to try products they are not otherwise buying from you, but when analyzing the results it is important to get a clear picture of whether they are drawing new, sustainable business, or cannibalizing existing business, or simply training customers to hold out for promotions.
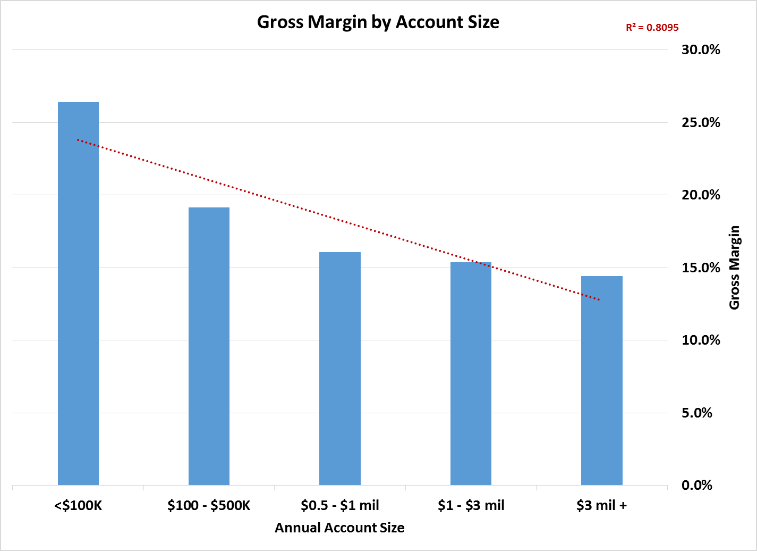 A second example worth considering was a client who said, “We are disciplined and we don’t give small customers big-customer pricing.” As evidence, the client produced a chart Gross Margin% by Account Size that showed a clear decreasing trend line as accounts got larger. So there was no opportunity there – right?
Just to check, we had the client take the middle category of accounts and create a scatter plot of Gross Margin% by Account with each account shown as a separate data point rather than being grouped together. As you can see in the new chart, there is no correlation between account size and margin and several accounts with very low margin. So perhaps there is some opportunity, and more digging will uncover it.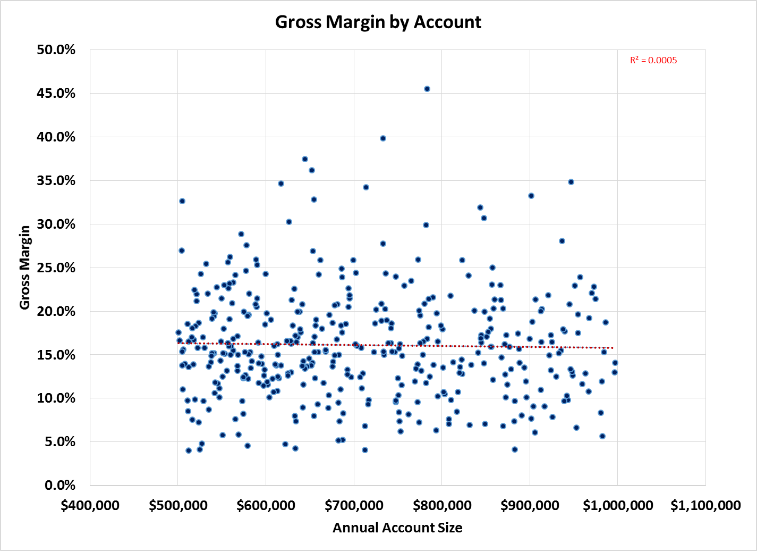
A third example of jumping to conclusions comes from a client who had identified accounts that appeared to be underpriced, and raised the prices on those accounts. A couple months after the price increase on the targeted accounts, the client observed that gross margin from the group of accounts whose prices were increased had decreased from the previous year’s monthly average. On the other hand, the gross margin from the rest of the business remained flat. The client cited that as evidence that the price increases had driven away business, and perhaps should be reversed. However when we dug into more details, we found that the reduction in gross margin was due to accounts that had stopped doing business with the client 6 months before the price changes took effect. Using the monthly average gross margin for decisions was dangerous because it hid the effect of the accounts that left for reasons other than price.
In these three examples and in the Medicare data example cited by the Wall Street Journal, it was enticing to draw conclusions early. Results were obtained that confirmed some pre-conceived beliefs, strengthening their convictions. However we can also see from these results that jumping to conclusions and acting quickly can result in unintended consequences, often disastrous. It remains important to analyze the data, but it is equally important to dig deep enough to understand why the results have occurred. It is not good enough to confirm our expectations with summary results. W e need to confirm the underlying causes.
Scott, great post. In retail, the ability to see category cross effects and cannibalization is key to promotions optimization. You may find it interesting that Tesco is doing this kind of analytics with KSS Retail. See http://kssretail.com/2014/04/14/kss-retail-enables-tesco-to-optimize-promotions-and-deliver-greater-value-to-shoppers/